Find peaks (maxima) in a time series. This function is modified from
pracma::findpeaks.
findpeaks(
  x,
  IsDiff = TRUE,
  nups = 1,
  ndowns = nups,
  zero = "0",
  peakpat = NULL,
  minpeakheight = -Inf,
  minpeakdistance = 1,
  y_min = 0,
  y_max = 0,
  npeaks = 0,
  sortstr = FALSE,
  IsPlot = F
)
Arguments
| x | Numeric vector. |
|---|---|
| IsDiff | If want to find extreme values, |
| nups | minimum number of increasing steps before a peak is reached |
| ndowns | minimum number of decreasing steps after the peak |
| zero | can be |
| peakpat | define a peak as a regular pattern, such as the default
pattern |
| minpeakheight | The minimum (absolute) height a peak has to have to be recognized as such |
| minpeakdistance | The minimum distance (in indices) peaks have to have
to be counted. If the distance of two maximum extreme value less than
|
| y_min | Threshold is defined as the difference of peak value with
trough value. There are two threshold (left and right). The minimum threshold
should be greater than |
| y_max | Similar as |
| npeaks | the number of peaks to return. If |
| sortstr | Boolean, Should the peaks be returned sorted in decreasing oreder of their maximum value? |
| IsPlot | Boolean. |
Examples
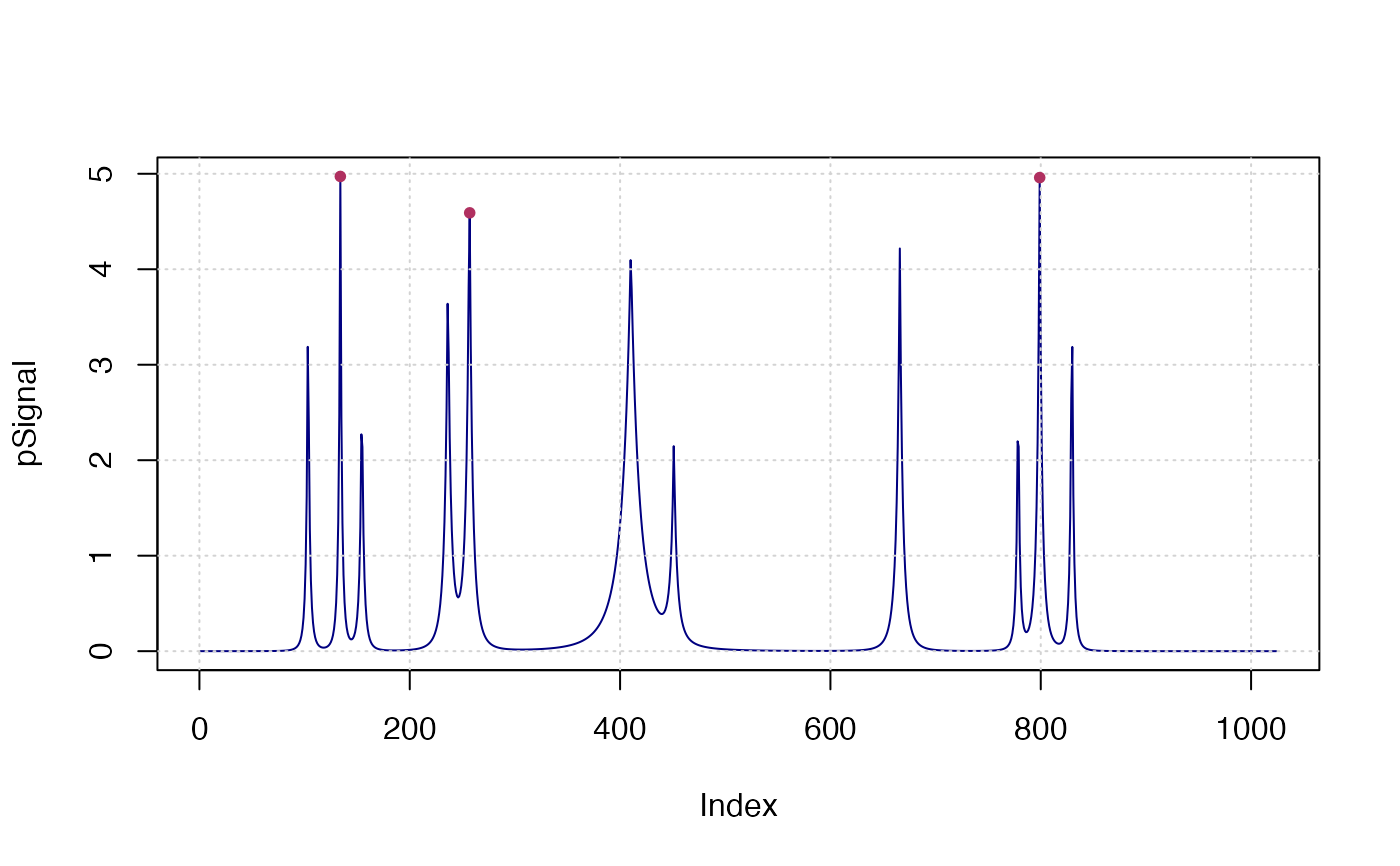
x <- seq(0, 1, len = 1024) pos <- c(0.1, 0.13, 0.15, 0.23, 0.25, 0.40, 0.44, 0.65, 0.76, 0.78, 0.81) hgt <- c(4, 5, 3, 4, 5, 4.2, 2.1, 4.3, 3.1, 5.1, 4.2) wdt <- c(0.005, 0.005, 0.006, 0.01, 0.01, 0.03, 0.01, 0.01, 0.005, 0.008, 0.005) pSignal <- numeric(length(x)) for (i in seq(along=pos)) { pSignal <- pSignal + hgt[i]/(1 + abs((x - pos[i])/wdt[i]))^4 } plot(pSignal, type="l", col="navy"); grid()
